tools – Timing and Data logging
Common tools for timing and data logging.
-
wait(time)¶ Pauses the user program for a specified amount of time.
Parameters: time (time: ms) – How long to wait.
-
class
StopWatch¶ A stopwatch to measure time intervals. Similar to the stopwatch feature on your phone.
-
pause()¶ Pauses the stopwatch.
-
resume()¶ Resumes the stopwatch.
-
reset()¶ Resets the stopwatch time to 0.
The run state is unaffected:
- If it was paused, it stays paused (but now at 0).
- If it was running, it stays running (but starting again from 0).
-
-
class
DataLog(*headers, name='log', timestamp=True, extension='csv', append=False)¶ Create a file and log data.
Parameters: - headers (col1, col2, …) – Column headers. These are the
names of the data columns. For example, choose
'time'and'angle'. - name (str) – Name of the file.
- timestamp (bool) – Choose
Trueto add the date and time to the file name. This way, your file has a unique name. ChooseFalseto omit the timestamp. - extension (str) – File extension.
- append (bool) – Choose
Trueto reopen an existing data log file and append data to it. ChooseFalseto clear existing data. If the file does not exist yet, an empty file will be created either way.
-
log(*values)¶ Saves one or more values on a new line in the file.
Parameters: values (object, object, …) – One or more objects or values.
By default, this class creates a
csvfile on the EV3 brick with the namelogand the current date and time. For example, if you use this class on 13 February 2020 on 10:07 and 44.431260 seconds, the file is calledlog_2020_02_13_10_07_44_431260.csv.See managing files on the EV3 to learn how to upload the log file back to your computer.
- headers (col1, col2, …) – Column headers. These are the
names of the data columns. For example, choose
Show/hide example: Logging and visualizing measurements
Example
This example shows how to log the angle of a rotating wheel as time passes.
#!/usr/bin/env pybricks-micropython
from pybricks.ev3devices import Motor
from pybricks.parameters import Port
from pybricks.tools import DataLog, StopWatch, wait

# Create a data log file in the project folder on the EV3 Brick.
# * By default, the file name contains the current date and time, for example:
#   log_2020_02_13_10_07_44_431260.csv
# * You can optionally specify the titles of your data columns. For example,
#   if you want to record the motor angles at a given time, you could do:
data = DataLog('time', 'angle')

# Initialize a motor and make it move
wheel = Motor(Port.B)
wheel.run(500)

# Start a stopwatch to measure elapsed time
watch = StopWatch()

# Log the time and the motor angle 10 times
for i in range(10):
    # Read angle and time
    angle = wheel.angle()
    time = watch.time()

    # Each time you use the log() method, a new line with data is added to
    # the file. You can add as many values as you like.
    # In this example, we save the current time and motor angle:
    data.log(time, angle)

    # Wait some time so the motor can move a bit
    wait(100)

# You can now upload your file to your computer
In this example, the generated file has the following contents:
time, angle
3, 0
108, 6
212, 30
316, 71
419, 124
523, 176
628, 228
734, 281
838, 333
942, 385
When you upload the file to your computer as shown above, you can open it in a spreadsheet editor. You can then generate a graph of the data, as shown in Figure 18.
In this example, we see that the motor angle changes slowly at first. Then the angle begins to change faster, and the graph becomes a straight line. This means that the motor has reached a constant speed. You can verify that the angle increases by 500 degrees per second.
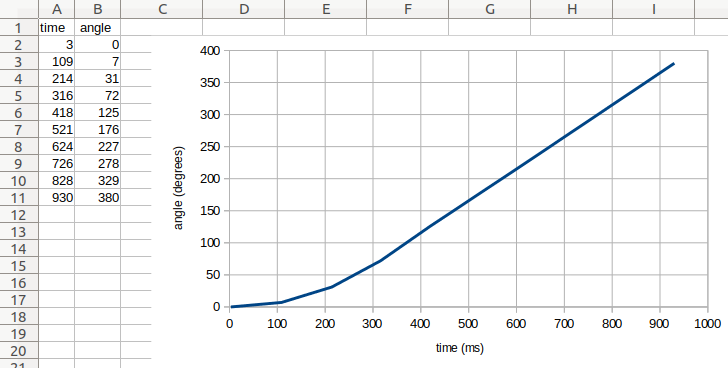
Figure 18 Original file contents (left) and a generated graph (right).
Show/hide example: Using the optional arguments
Example
This example shows how to log data beyond just numbers. It also shows how
you can use the optional arguments of the DataLog class to choose the
file name and extension.
In this example, timestamp=False, which means that the date and time
are not added to the file name. This can be convenient because the file
name will always be the same. However, this means that the contents of
my_file.txt will be overwritten every time you run this script.
#!/usr/bin/env pybricks-micropython
from pybricks.parameters import Color
from pybricks.tools import DataLog

# Create a data log file called my_file.txt
data = DataLog('time', 'angle', name='my_file', timestamp=False, extension='txt')

# The log method uses the print() method to add a line of text.
# So, you can do much more than saving numbers. For example:
data.log('Temperature', 25)
data.log('Sunday', 'Monday', 'Tuesday')
data.log({'Kiwi': Color.GREEN}, {'Banana': Color.YELLOW})

# You can upload the file to your computer, but you can also print the data:
print(data)